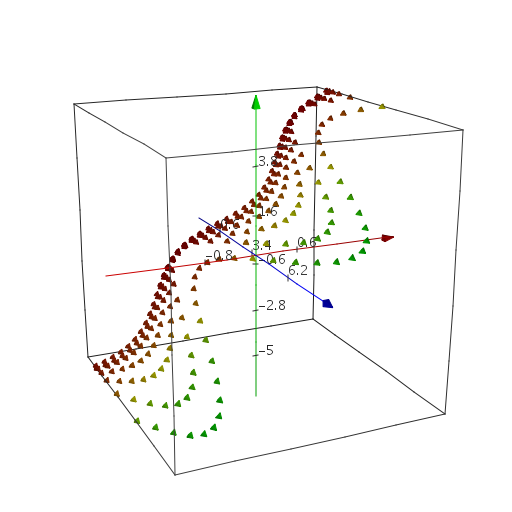

Giessen5DPlot is a visualization and filtering tool for large multi-column data files, for instance from spread-sheet programs. Data for three columns can be visualized along the axes X,Y,Z, two more columns can be visualized by color and size of data symbol. The graph can be rotated and zoomed. Data in all columns can be filtered by value. Giessen5DPlot provides a simple and quick way to analyse large multi-dimensional data. Selected data can be exported as a spread-sheet or picture. Executables for Mac, Linux and Windows, a test data file and a short manual are available for download.