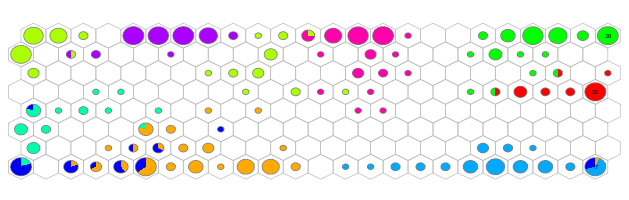
somplot: Visualisation of hexagonal Kohonen maps
somplot is an R package for creating high-quality visualisations from self-organising maps of hexagonal topology.
File sets generated by Teuvo Kohonen’s SOM_PAK software can be used directly as input for the functions of this package.
The plotting function uses reasonable default settings and is able to produce publication-ready graphics at first go. Optional arguments allow for customisation of colouring, scaling and legend.
You can render the visualisations on our server interactively or download the R-package for offline use within your local R installation.
Research
Research interests and projects
somplot
Web interface: Get visualisations for your data.
Download: Installation instructions for the R-package.
Example data: Download an example dataset.